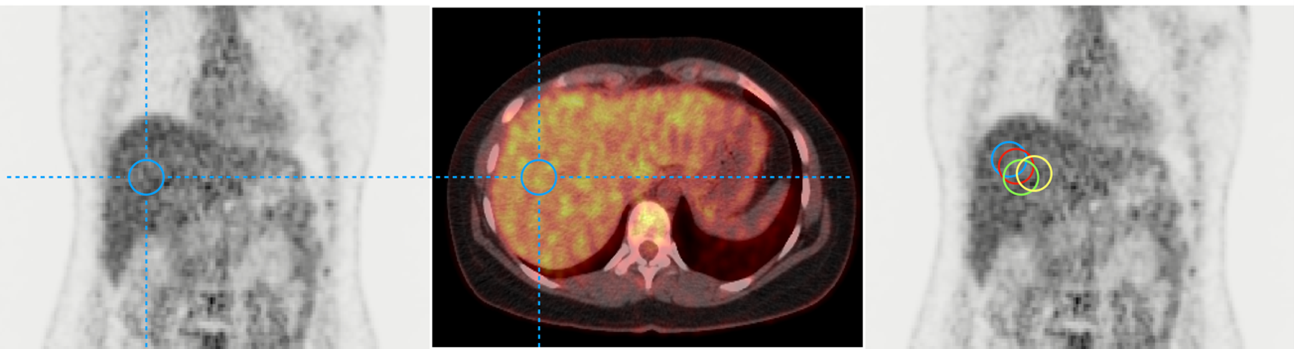
Positron Emission tomography Response Criteria In Solid Tumors (PERCIST) allows us to assess tumor metabolic response with 18F-FDG PET. Its use in clinical routine is often limited by tedious manual operations that must be performed.1 One of them is the quantification of the liver background activity (BA), which may suffer due to inter-reader variability (Fig1). In this work, we aim to perform an automatic quantification of (BA) from PET data using a multi-step approach.
Methods
The BA quantification is generally computed placing a sphere of 3 cm in a potential uniform region of the right part of the liver, between the dome and the lower limit. We automated this operation with a workflow of sequential steps.
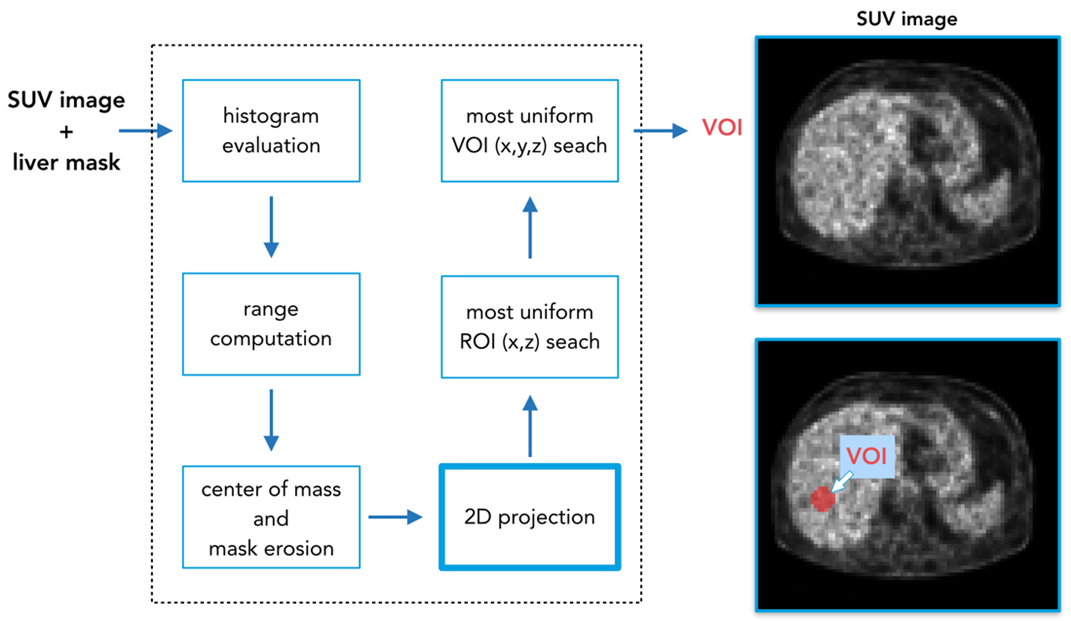
To begin, we performed liver segmentation using a convolutional neural network (CNN) to delimit the working region on PET images with SUV rescaled values.2 After that, our approach consisted of a series of processing steps to automatically select the 3 cm sphere (Fig. 2).
First, we calculated the histogram on the extracted liver and considered the full width at half maximum (FWHM) to identify the range of the average SUV values and use the corresponding points as potential centers for the 3 cm sphere. We then calculated the center of mass in the liver mask and used its coordinates to filter out points in the liver left part. Moreover, we eroded the mask to avoid regions too close to the organ borders. At this point, we performed a coronal projection using standard deviation on the coronal slices delimited by the liver mask. We computed an iterative search of the most uniform region (avoiding possible liver lesions), selecting the 2D circle with the lower ratio (R) given by standard deviation (σ) and mean value (μ) of the inscribed pixel values (see formula below for Eq. 1). Finally, once the region was detected, we explored the coronal direction searching this time for the 3D sphere with lowest R.
Equation 1:

Results
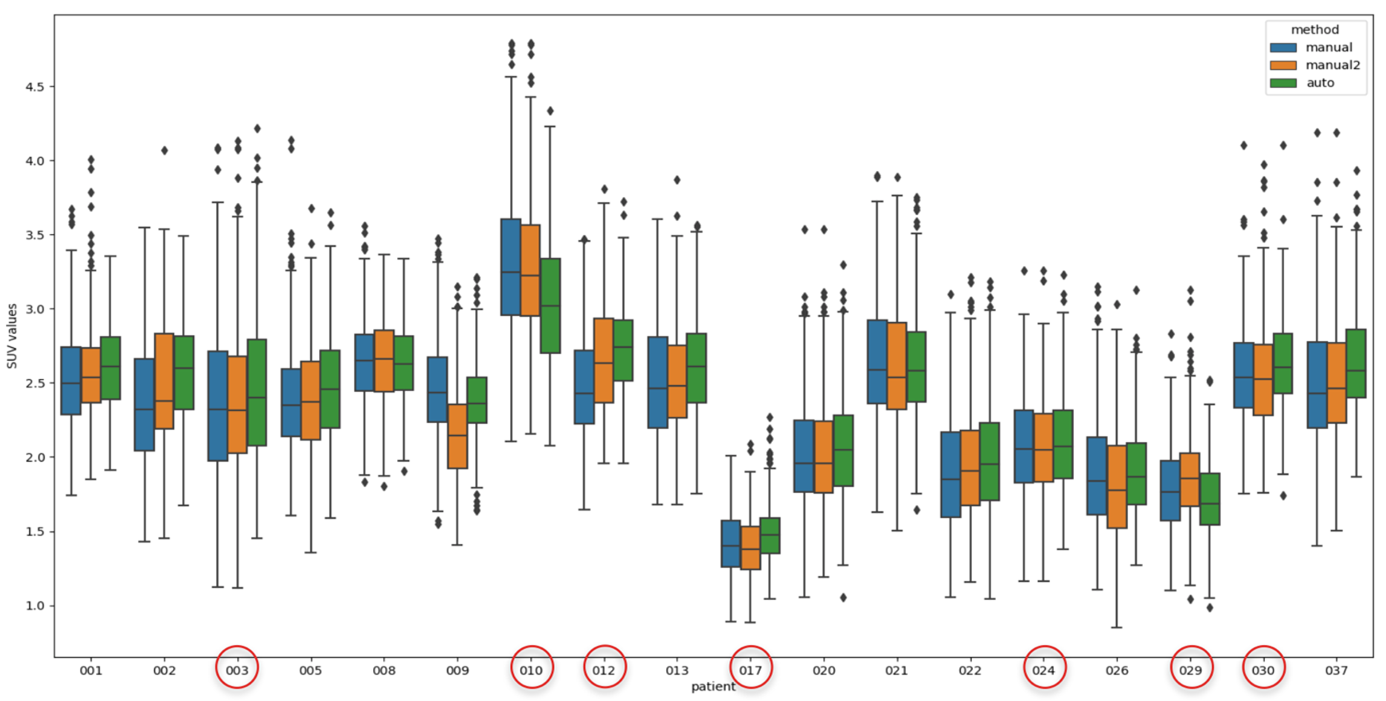
The BA quantization was evaluated on 18 patients enrolled for a study on breast cancer metastasis. We compared the BA results obtained by automatic measurements with manual annotations provided by two non-experts using Pearson correlation and Mean Absolute Error (MAE). The results showed a high agreement between the automatic and the two manual measurements (0,974 and 0,961) with a low MAE (0,089 and 0,092) [kBq/ml].
We measured a mean runtime of 3 seconds for BA quantification using 4 CPUs working in parallel. In the group of 18 patients, we also included seven patients with liver lesions marked with a red circle in Fig.3. In doing that, we showed how the proposed algorithm was able to select a uniform region in the liver, avoiding the lesions inside.
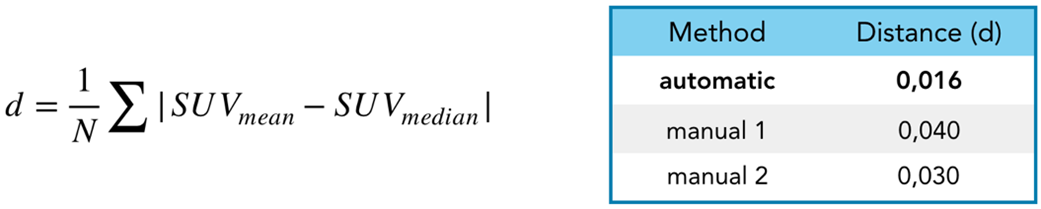
Finally, we measured the distance between the mean SUV and median SUV inside the final VOI according to the expression in Fig. 4. We can ideally suppose that the smaller the difference, the more likely it is that we have selected a uniform region. As we can see in Fig. 4, the smaller distance was recorded for the VOI automatic selection.
Conclusion
In this first step toward a PERCIST automatization process, we have presented a method to automatically measure the liver BA from PET data in a reproducible way.
You can view these findings in a poster format here.
References
- Wahl, R. L. (2018). PERCIST in perspective. Nuclear medicine and molecular imaging, 52(1), 1-4.
- Santini, G., Fourcade, C., Rousseau, C., Ferrer, L., Campone, M., Colombié, M., & Rubeaux, M. (2020). Segmentation automatique des métastases hépatiques en imagerie tep/tdm basée sur l’apprentissage profond dans le cadre du cancer du sein métastatique. Médecine Nucléaire, 44(2), 135.